If you are an income-focused investor looking for high monthly payouts, you have likely crossed paths with JPMorgan’s two heavyweight ETFs: JEPI (JPMorgan Equity Premium Income ETF) and JEPQ (JPMorgan Nasdaq Equity Premium Income ETF).
At first glance, they look almost identical. Both are actively managed, both use a covered call strategy to generate massive dividend yields, and both pay you every single month. However, looking under the hood reveals two completely different engines driving these funds.
In this guide by Snowball Yields, we will break down the crucial differences between JEPI and JEPQ to help you decide which premium income ETF is the perfect fit for your portfolio.
1. Meet JEPI: The Defensive Yield Generator
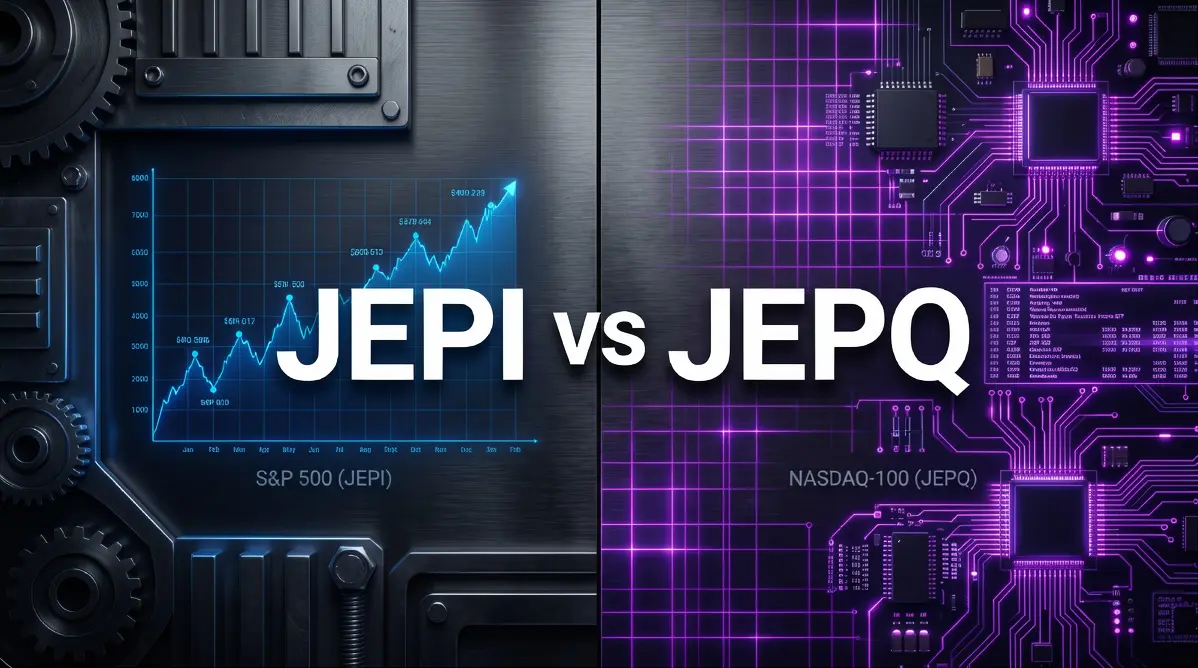
JEPI is the older sibling and the undisputed king of covered call ETFs by Asset Under Management (AUM). Its primary goal is to deliver a significant portion of the returns associated with the S&P 500 index with less volatility.
How it works: JEPI builds a portfolio of low-volatility, high-quality U.S. large-cap stocks (think defensive sectors like healthcare, consumer staples, and utilities). It then sells out-of-the-money call options on the S&P 500 index using Equity-Linked Notes (ELNs) to generate high monthly income.
Why Investors Choose JEPI:
- Lower Volatility: JEPI is explicitly designed to be less volatile than the broader market. When the market drops, JEPI typically drops less.
- Defensive Positioning: It leans heavily into value stocks rather than high-flying tech, making it a safer bet during economic uncertainty.
- Who is it for?: Conservative investors, retirees, or anyone looking for a reliable 7-9% yield with maximum capital preservation and lower heart rates during market pullbacks.

2. Meet JEPQ: The Tech-Powered Income Engine
JEPQ is the aggressive younger sibling. Launched in 2022, it applies JPMorgan’s proven covered call strategy to the Nasdaq-100 Index, which is heavily concentrated in technology and growth stocks like Apple, Microsoft, and Nvidia.
How it works: Similar to JEPI, it holds a basket of stocks (but focuses on the Nasdaq-100) and sells call options against the Nasdaq-100 index to generate income. Because the Nasdaq is naturally more volatile than the S&P 500, the option premiums are more expensive, resulting in a higher dividend yield for JEPQ investors.
Why Investors Choose JEPQ:
- Maximum Yield: JEPQ consistently outputs a higher dividend yield than JEPI (often hovering in the 9-11%+ range) due to the higher volatility of the tech sector.
- Tech Exposure: It allows investors to hold the world’s most innovative companies while still getting paid a massive monthly dividend.
- Who is it for?: Growth-minded income investors who want higher payouts and are willing to accept the sharper price swings associated with the technology sector.

3. Head-to-Head: JEPI vs JEPQ
To see how they stack up, let’s look at a side-by-side comparison of their core mechanics:
| Feature | JEPI (Defensive Income) | JEPQ (Aggressive Income) |
| Underlying Focus | S&P 500 (Value & Defensive) | Nasdaq-100 (Tech & Growth) |
| Historical Yield | ~7% – 9% | ~9% – 11%+ |
| Market Volatility | Lower than the market | Higher than JEPI, similar to market |
| Capital Growth | Moderate | Higher Potential (but capped by calls) |
| Best Market Condition | Flat or slightly down markets | Flat or slightly up tech markets |

The Verdict: Which Should You Buy?
Choosing between JEPI and JEPQ comes down to your personal risk tolerance and sector preference.
If you want to sleep soundly at night knowing your principal is relatively stable while collecting a solid 8% yield, JEPI is your champion. However, if you believe in the long-term dominance of the tech sector and want to squeeze every last drop of yield out of your portfolio, JEPQ is the clear winner.
The Snowball Strategy: Many modern investors refuse to choose just one. Building a 50/50 split of JEPI and JEPQ creates a beautifully balanced portfolio—giving you the defensive anchor of the S&P 500, the aggressive growth of the Nasdaq, and a blended double-digit yield that pays you every single month.
Ready to see how much income you could generate? Don’t just guess your future wealth. Use our free JEPQ Projection Tool to simulate your monthly cash flow, visualize your DRIP snowball effect, and plan your exact path to financial freedom today!